What is the difference between CRI and TM-30 in LED lighting?
What is the difference between CRI and TM-30 in LED lighting?
Introduction
Light is a dream that has been relentlessly pursued throughout the long history of humankind. Since ancient times, human beings have been faced with the fear of the night, so they dispel the darkness by holding up torches. With the passage of time and the development of technology, human history has gone through the development process of paraffin lamps, electric lamps, fluorescent lamps, halogen lamps, high-pressure sodium lamps, metal halide lamps and LED lamps. Street lamps, for example, it was adopted in 1417 is to paraffin lamps as a light source, with the invention of electric lamps in 1879 its gradual replacement. Into the 20th century, fluorescent lamps, halogen lamps, high-pressure sodium lamps and metal halide lamps, etc. developed, street lamps also began to use such lamps as a light source, of which high-pressure sodium lamps are still used in some road lighting, while the metal halide lamps are more used in the stadium lighting, which is because of its high colour rendering index. With the emergence of LED technology in 1969, street lamps, factory lamps, floodlights and stadium lamps ( Check to see more sports lights from ZGSM ) have gradually begun to use LED as a light source, which, in addition to energy-saving, also has a high CRI and stability and so on. This article mainly explains the CRI index of LED, and the corresponding reports such as LM79, TM-30-18, IEC62717 report and so on.
What’s CRI?
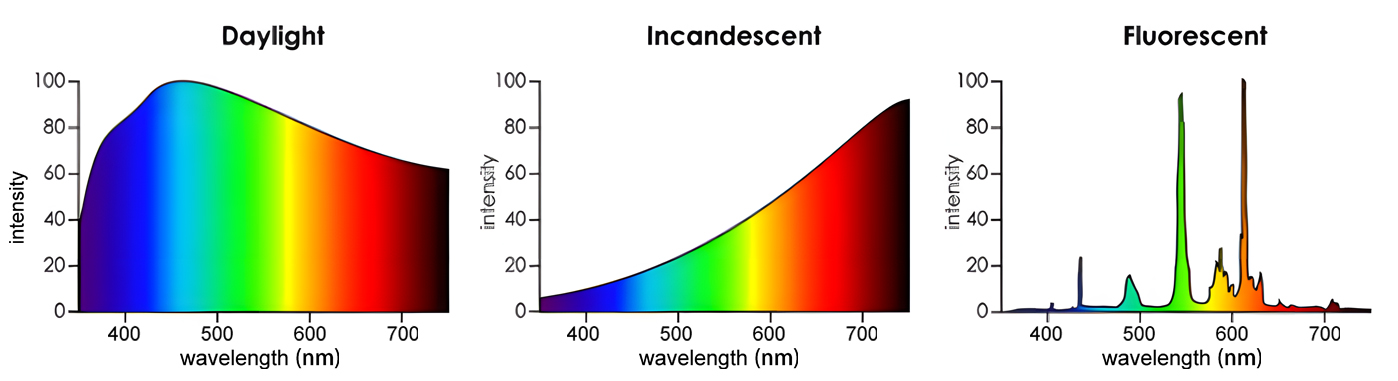
The colour rendering index, or CRI, is a measure of a light source’s ability to bring out the true colour of an object. Simply put, the higher the CRI of a light source, the closer the colour of the object it illuminates will be to the colour that would be seen in an ideal light source or in natural light. The International Commission on Illumination ( Who is CIE? )explains colour rendering in this way: Colour rendering is the property of a light source to produce a colour effect on an object when compared to the colour effect of a reference light source (e.g. natural light) on the object. Theoretically, the maximum value of the colour rendering index CIE Ra is 100, when the light source is a standardised daylight or blackbody, the colour rendering index is 100. Here it is necessary to differentiate between CRI and CCT, the colour rendering index CRI of the light source does not directly indicate what colour the light source itself is, the colour of the light source itself is related to the correlated colour temperature, whereas the colour rendering index is mainly related to the spectrum of the light source. The colour rendering index is mainly related to the spectrum of the light source. As an example, the spectrum of an incandescent lamp is continuous, it contains all the frequencies in the visible spectrum, similar to natural light, so its CRI can be considered to be CRI100. While fluorescent lamps have a wavelength distribution of the spectrum, with some wavelengths having a high content of light, and some wavelengths accounting for almost 0% of the light, so the fluorescent lamps have a very low CRI. Typical LEDs, on the other hand, have a CRI of 70 or more, and high ones can reach a CRI of 90.
How is CRI calculated?
We know that Ra is the arithmetic mean of R1 to R8, so how are R1 to R8 calculated and what do they mean? CIE (International Commission on Illumination) stipulates 8 standard colour samples, namely R1 to R8, which have different hues, saturation and lightness, and basically cover the range of common colours, i.e. R1 (reddish red), R2 (dark yellow), R3 (lemon green), R4 (light green), R5 (light blue), R6 (mauve), R7 (reddish red), R8 (yellowish green), R4 (light green), R5 (light blue), R6 (mauve), R7 (light red), R8 (light yellowish green). Professional laboratories will use spectroradiometers and other equipment to measure the spectral reflectance or transmittance of the eight standard colour samples under the light source to be tested and the reference light source (usually a daylight simulator), and then obtain the triple stimulus values (X, Y, Z) of the colour samples under the two light sources by calculation. According to the triple stimulus values (X, Y, Z), they are converted to colour coordinates (x, y) by a specific formula. The commonly used colour co-ordinate system is the CIE 1931 colour co-ordinate system. The colour co-ordinates (x, y) accurately represent the position of the colour on the colour chart. By comparing the difference between the colour coordinates of the colour samples under the light source to be measured and the reference light source, a specific formula is used to calculate the special colour rendering index (Ri) of each colour sample. The CIE-recommended colour difference formula, e.g. ΔEab (CIELAB colour difference formula), is generally used to calculate the colour difference ΔEab of a colour sample under two light sources, which is then converted into the special colour rendering index Ri according to the formula Ri = 100-4.6ΔEi*:, where ΔEi*: is the colour difference between the ith colour sample under the light source to be measured and the reference light source. The special colour rendering indices (R1 to R8) of the eight standard colour samples are arithmetically averaged, and the average value obtained is the general colour rendering index of the light source, Ra. Ra is in the range of 0 to 100, and the closer it is to 100, the closer the colour rendering of the light source is to that of an ideal light source (e.g., daylight or blackbody radiation).
What’s TM-30?
The IES TM-30 is a colour rendering evaluation method introduced by the IES (Illuminating Engineering Society of North America) in 2015 to address the limitations of the Ra (CRI).The IES TM-30 report provides a more comprehensive and accurate method of evaluating the colour rendering performance of a light source, and provides a much more detailed picture of a light source’s ability to reproduce different colours than traditional colour rendering indices such as the Ra. The TM-30 uses 99 colour samples (far more than the CRI’s 8 samples), which cover a wider range of hue, saturation and luminance and are more comprehensive. In 2018 IESNA ( IESNA is also famous for IESNA light distribution )updated its TM-30 standard to include adjustments to the spectral reflectance calculation function, fine-tuning of the Rf calculation formula, adjustments to the colour temperature range of the reference light source, and more. Below are some of the key metrics provided by TM-30:
How is TM-30 calculated?
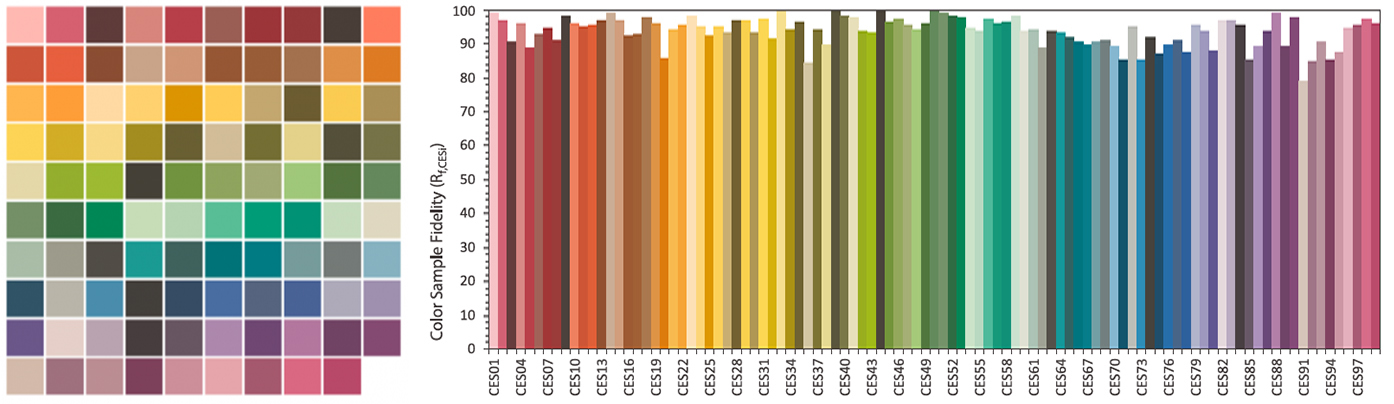
In order to obtain the TM-30 results, the spectral power distribution (SPD) of the light source needs to be determined first. Depending on the Correlated Colour Temperature (CCT) of the light source ( What’s the different light source? ) under test, either a blackbody radiation (for warm light sources) or a CIE D-series light source (for cool light sources) is selected as the reference light source.Based on the SPDs of the light source under test and the reference light source, we can then calculate their colour coordinates and evaluate their colour shifts for the 99 Colour Evaluation Samples (CES) as well as the colour gamut area.The 99 colour samples are standardized colour samples defined by TM-30-18, covering a wide range of hues and saturations, and finally we can obtain the Rf and Rg values. Rf is the arithmetic mean of the 99 Rf,i, where Rf,i=100-6.73△Ei is the colour rendering index of the ith colour sample, which measures the colour reproduction capability of the DUT compared with the reference light source for the ith colour sample. Rg is calculated as Rg=100xTest light source gamut area/reference light source gamut area, where gamut area is the area enclosed by the average chromaticity coordinates (μ′,ν′) of 99 CESs.
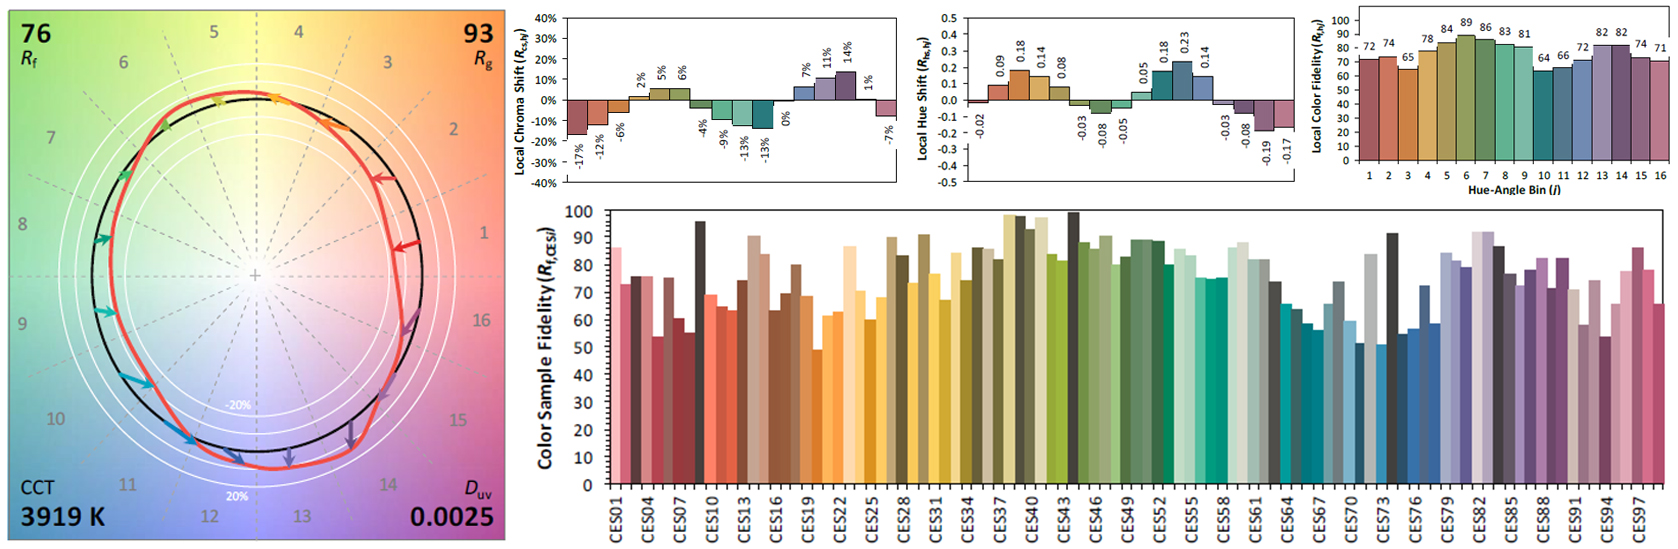
In addition, the TM-30 report also provides a colour vector graphic. A colour vector graphic is based on a reference light source (e.g., a blackbody radiation source or a standard illuminant). By measuring the colour differences between the colour samples under the light source to be measured and the corresponding colour samples under the reference light source, these differences are plotted as vectors on a specific chromaticity map. Each vector has two key attributes, direction and length. The direction represents the direction of the colour shift, e.g. towards red, green or blue, etc.; the length indicates the extent of the colour shift, the longer the length, the greater the colour shift, i.e. the more obvious the difference between the colour sample under the light source to be measured and the colour sample under the reference light source. Please check the below figure.
ZGSM LED lighting solutions
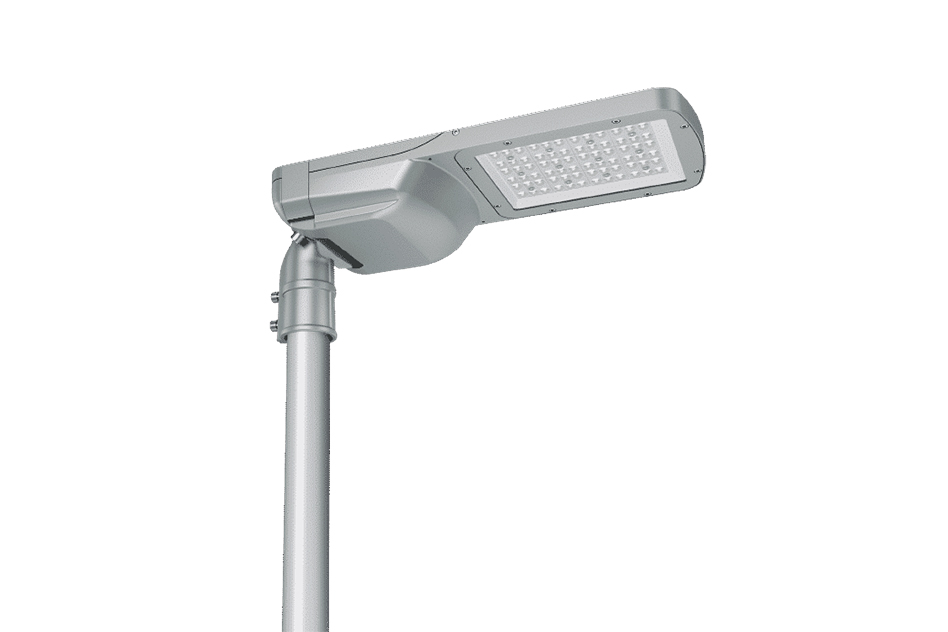
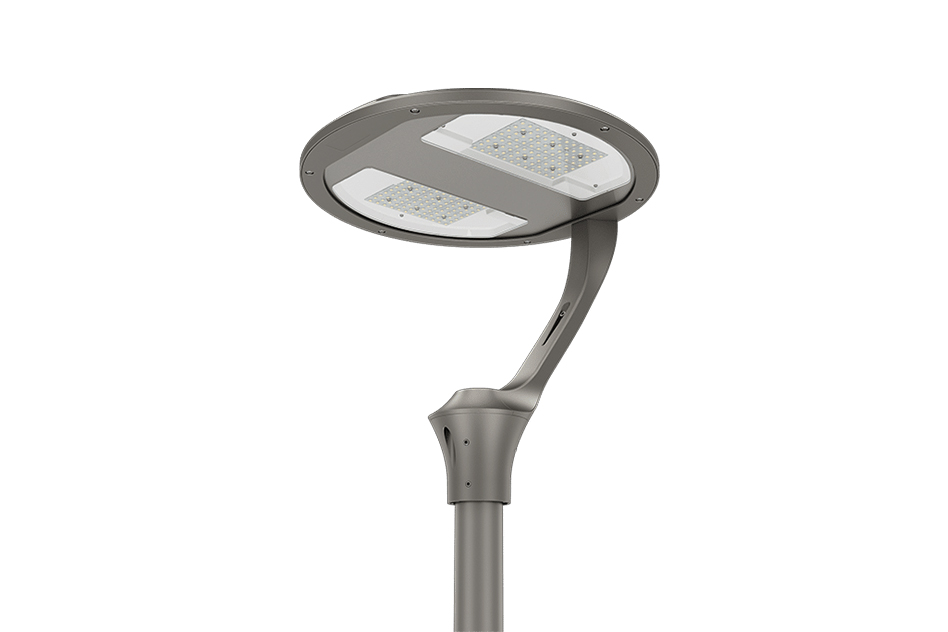
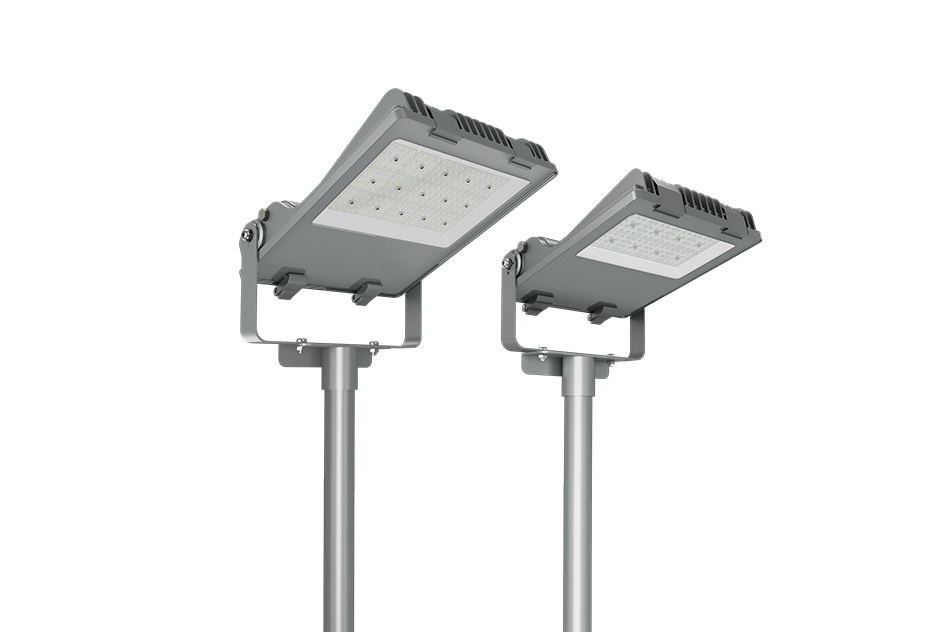
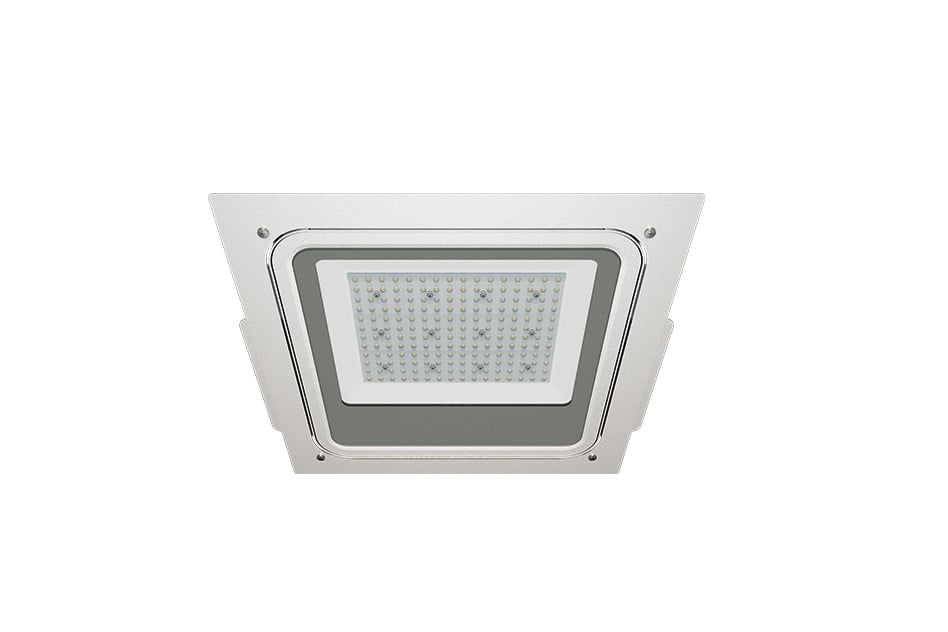
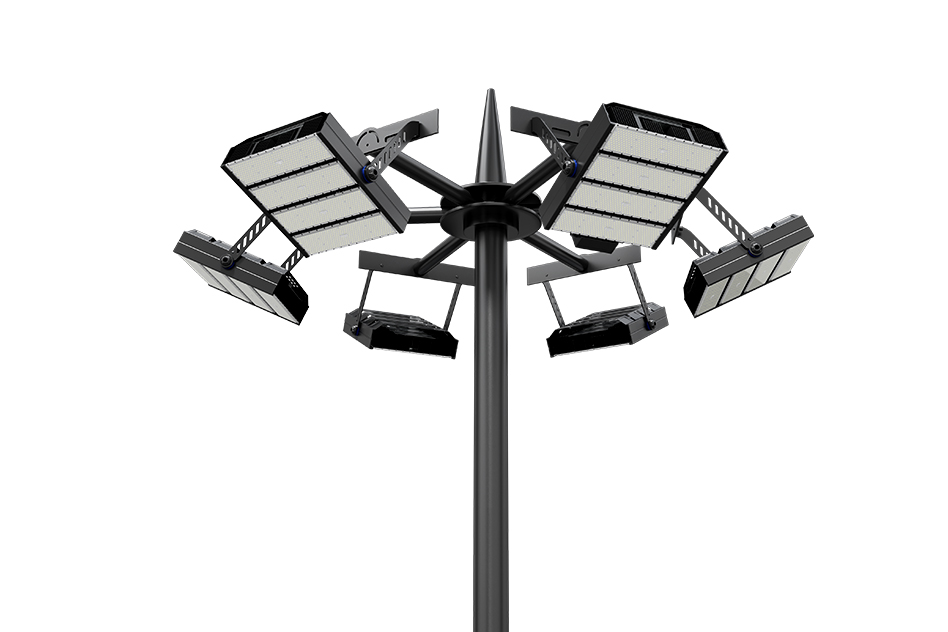
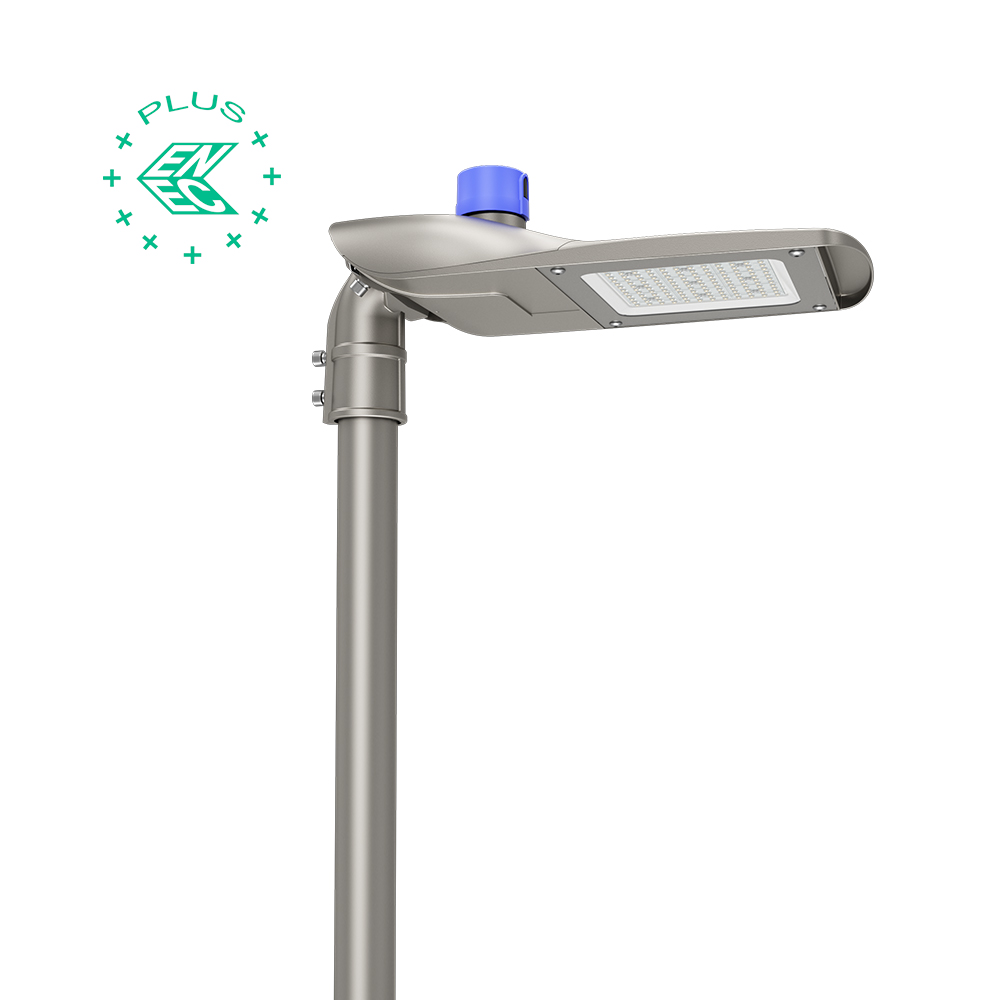
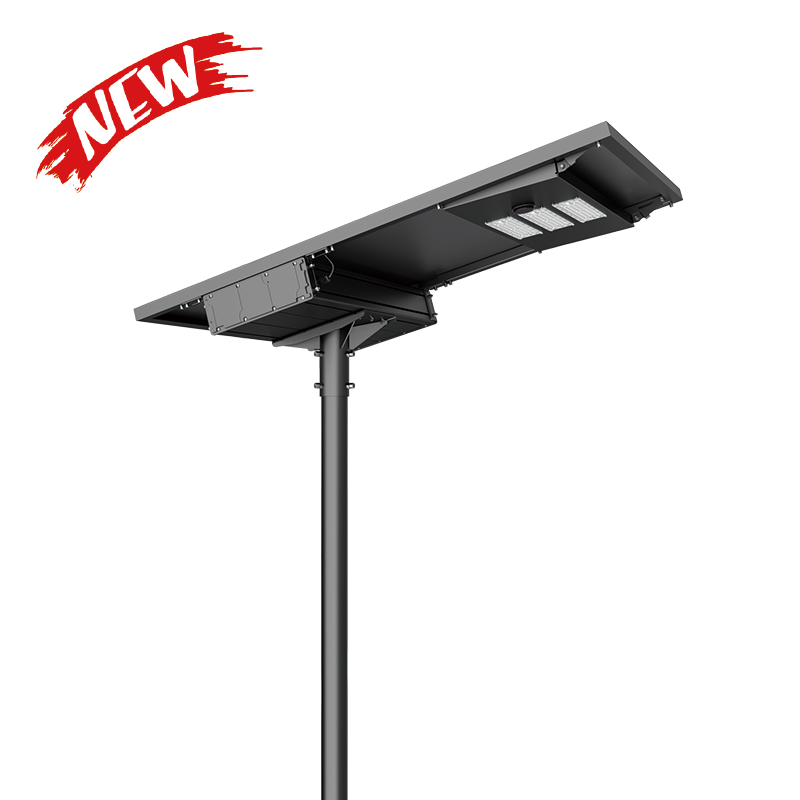
ZGSM produces many types of lamps, including street lamps, factory lamps, floodlights ( Check to see more ZGSM flood lights ), stadium lamps ( View LED outdoor stadium lighting supplier ), gas station lamps, and solar street lamps. These lamps can be equipped with different types of lamp beads, such as 3030, 5050, and 2835. For different configurations, we will conduct LM79 tests, and the test report contains important parameters such as CRI (color rendering index). The following are different types of LED lamps from ZGSM. If you are interested, you can click on the corresponding link to view our LED products.
The LM79 report provides users with a variety of information needed for LED products, including electrical parameters and optical parameters in addition to CRI. Electrical parameters cover input voltage, current, power, power factor ( What’s PF? ), total harmonic distortion (THD), etc.; optical parameters include total luminous flux, luminous efficacy, correlated color temperature (CCT), etc. It is worth noting that since 2022, the TM-30-18 standard (i.e., information such as Rf, Rg and color vector graphic) has become a mandatory requirement and is required to be included in the LM79 report. Therefore, chromaticity coordinates, color rendering index (Ra), R9, Rf, Rg and color vector graphic are also included in the optical parameters of LM79.
CRI results of ZGSM LED lights
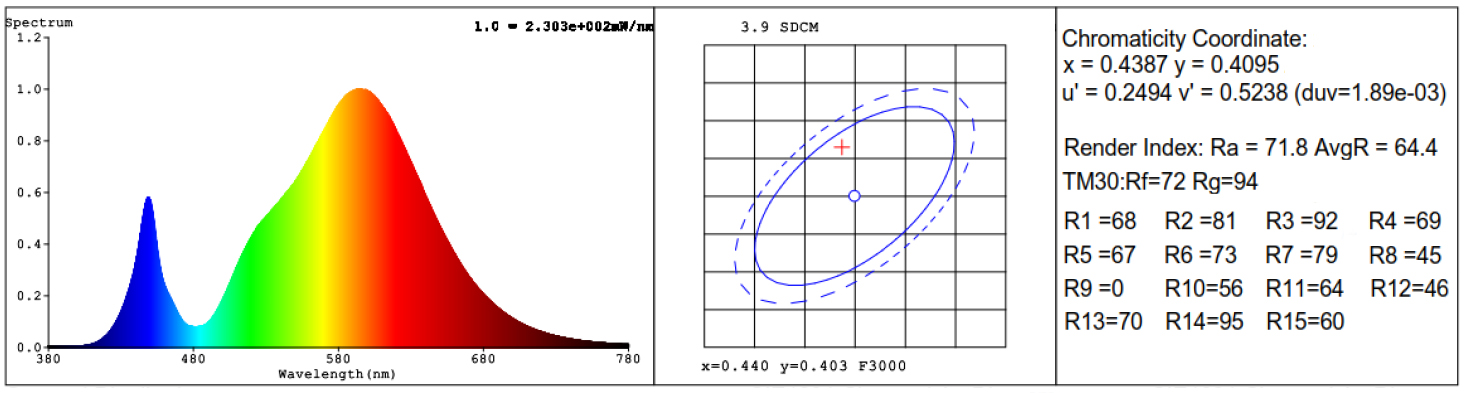
If customers want to know the Ra value of a lamp, the quickest way is to ask the supplier for an LM79 report or an IEC62722 report. The LM79 report contains R1-R8, Ra, R9, which are the lamp parameters that customers care about. These parameters can also be found in the IEC62722 report. The following figure shows the test results of the ZGSM Falcon street light including spectral distribution, CRI, color coordinates, and color tolerance (SDCM).
TM-30 result of ZGSM LED lights
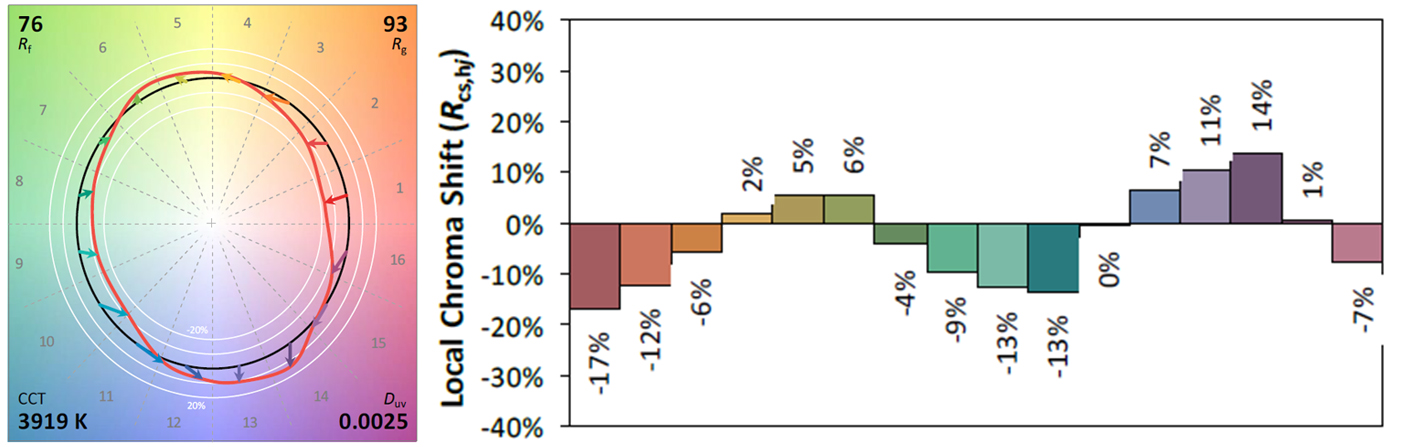
If the project has clear requirements for TM-30-18 results, we can ask the supplier for the latest version of LM79 report or a single TM-30-18 test report. In these reports, we can find information such as Rf, Rg and color vector graphic. The following is the TM-30-18 result of the ZGSM Leaf series 100W street light. We can see that Rf=76, Rg=93, and the color vector graphic shows that the color saturation of the tested light source in areas 1, 2, 8, 9, 10, and 16 is not good enough.
Summary
In this article, we explored the concept of CRI (color rendering index), which measures the accuracy of a light source in displaying the color of an object compared to natural light. We also discussed how to calculate CRI and introduced TM-30-18, a more advanced method for evaluating color reproduction that includes additional indicators such as Rf (fidelity), Rg (color gamut), color vector graphics, etc. We also explained the calculation of TM-30 results, which better reflects the color reproduction ability of the tested light source due to the 99 color samples. Finally, we focused on ZGSM LED lighting products, which provide both CRI and TM-30 results to reflect the color performance of the product in various lighting applications ( More about ZGSM lighting applications ). If you are interested in the corresponding products and test results, you can contact ZGSM for more information.
Related Products


Related Blogs


Related Cases


People also ask
Author introduction

Hello Customers,
My name is Taylor Gong, I’m the product manager of ZGSM Tech. I have been in the LED lights industry for more than 13 years. Good at lighting design, street light system configuration, and bidding technology support. Feel free to contact us. I’m happy to provide you with the best service and products.
Email: [email protected] | WhatsApp: +8615068758483